Statistical Consulting, Data Analysis and Reporting

Methodological Support for Research and Data Analysis

Whether you are working on a thesis, a research study or an analytical report, the focus is on analysis that is methodologically sound, transparent and clearly communicated.
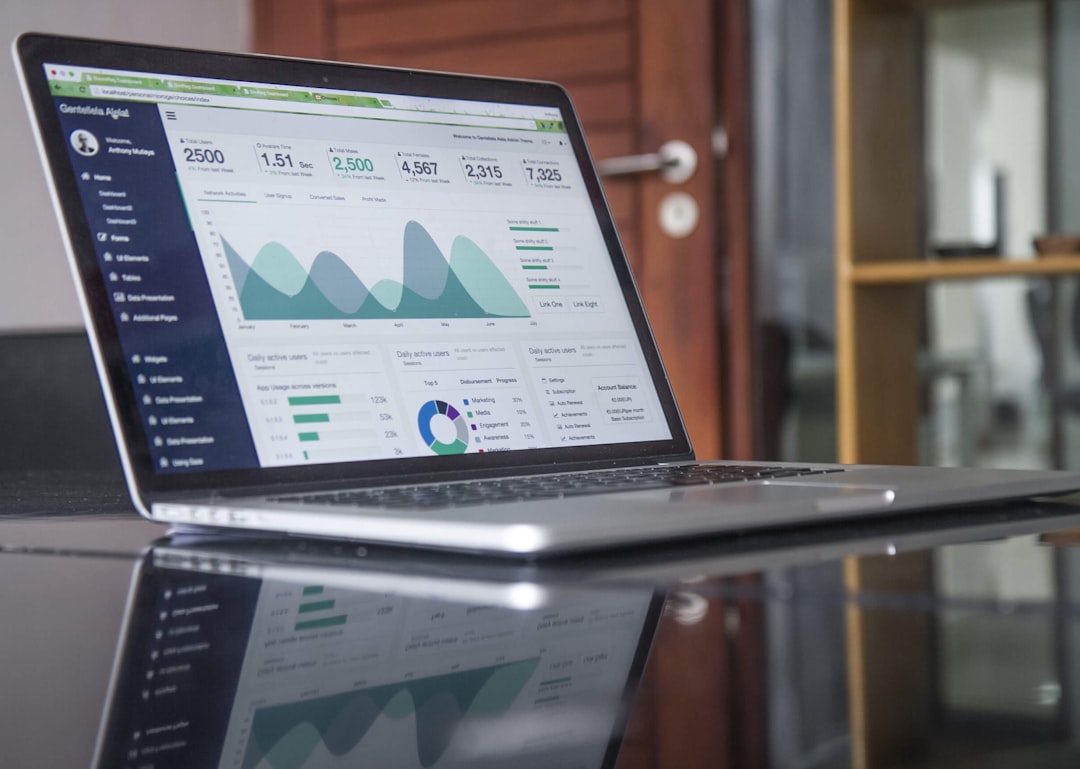

Statistics on a laptop
Google Analytics overview report
Made with Canon 5d Mark III and loved analog lens, Leica APO Macro Elmarit-R 2.8 / 100mm (Year: 1993)

Data Analysis and Modelling

Support with preparing, checking and analysing quantitative data, from descriptive analysis and hypothesis testing to regression and multivariate methods. The aim is to provide a clear and well-founded interpretation that can be used directly in a report, thesis or presentation.

Selected methodological examples will be added to the blog over time.

Theses and Research Papers

Support for bachelor’s and master’s theses, doctoral dissertations and manuscripts intended for academic journals, from developing the research question, hypotheses and study design to statistical analysis, interpretation and the presentation of results. The aim is to provide a methodologically sound analysis that can be incorporated into the methods, results and discussion sections.

Selected examples will be added to the blog over time.

A close-up of a hand with a pen analyzing data on colorful bar and line charts on paper.
Overhead view of financial charts, laptop, and magnifying glass, ideal for business analysis themes.
Top view of business analytics paper including charts and notes with a magnifying glass and pencils.

Let’s Get Started!

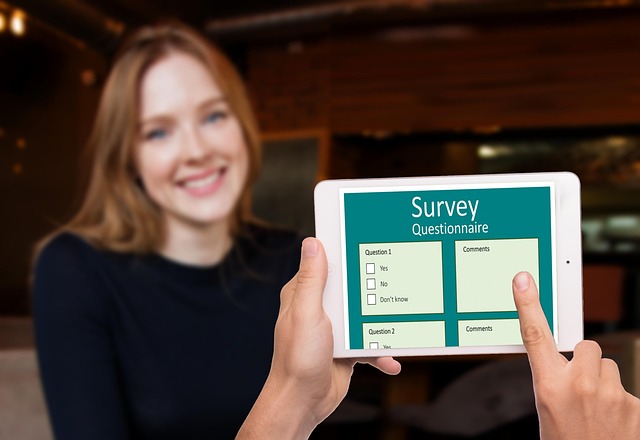
survey, interview, questionnaire, market, research, customer, satisfaction, marketing, checklist, woman, questions, answers, tablet, poll, survey, survey, survey, survey, survey, questionnaire, questionnaire, questionnaire, questionnaire
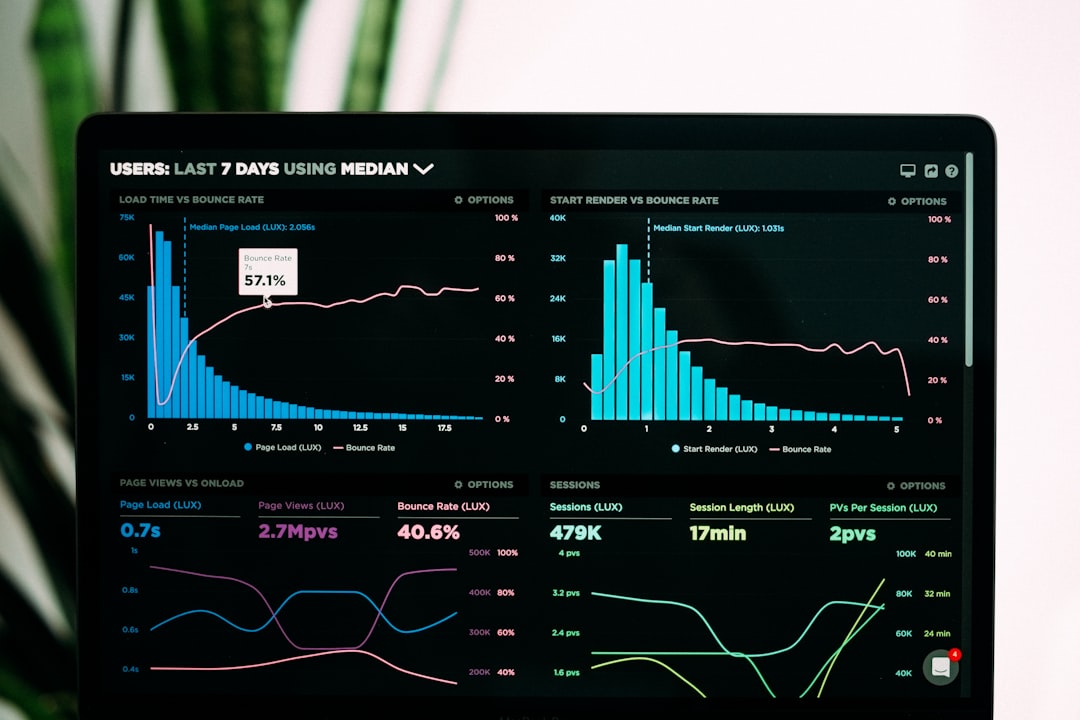
Speedcurve Performance Analytics
Statistics on a laptop

Survey Design and Data Collection

Support with the design, implementation and analysis of quantitative surveys, from questionnaire structure, pretesting and data quality to statistical analysis and the presentation of results. The aim is to develop an analysis plan that addresses the research question and enables the collected data to be analysed in a transparent and meaningful way.

Methodological examples on questionnaire design and survey data analysis will be added to the blog over time.

Reporting and Presentation

Statistical results are prepared for reports, theses, presentations and decision-making documents. Tables, figures and accompanying text are structured so that the key findings are clear, transparent and appropriately contextualised.

Methodological examples of data visualisation and results reporting will be added to the blog over time.

Google Analytics overview report
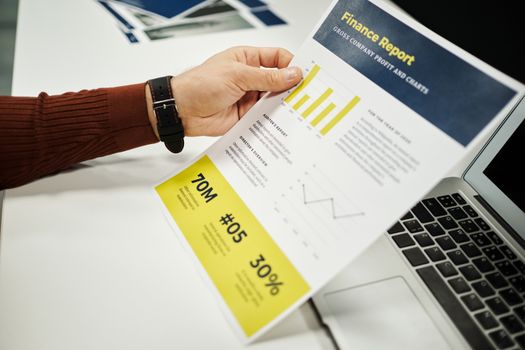
Person analyzing finance report with graphs at desk, ideal for business concepts.
A close-up of a hand with a pen analyzing data on colorful bar and line charts on paper.

Looking for guidance on the right methodological approach?

Briefly describe what you need and receive an initial, no-obligation assessment of the most suitable approach, the data required and the next steps.

Scroll to Top